Generally, our blogs have been about one of three topics: civil society analysis, horizon scanning and employee engagement within the civil service.
The first two topics are no longer part of the team’s remit. Civil society analysis is now the responsibility of the Department for Digital, Culture, Media and Sport following the transfer of the Office for Civil Society in 2016. Our work on horizon scanning also transferred to another part of the Cabinet Office in 2015.
Our work on employee engagement and delivering the Civil Service People Survey continues, but posts about this work will now appear on the main Civil Service blog.
Please note, if you have subscribed to our blog to receive updates, your email address will be removed from our system.
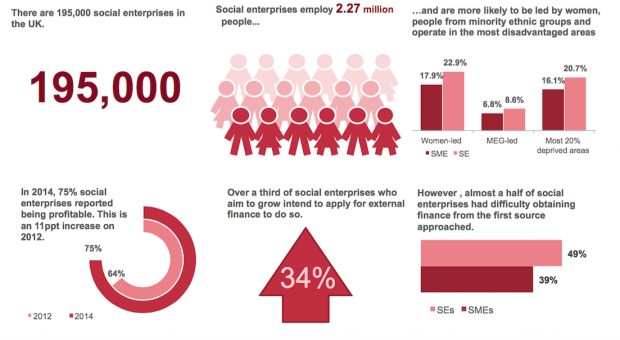
]]>Last year the Cabinet Office teamed up with the Department for Communities and Local Government to explore how Community Organisers could support local communities in exercising the rights introduced in the Localism Act 2011. A Community Organiser Mobilisation fund was established to resource a programme of work delivered by CO Ltd and Locality. The Analysis and Insight Team supported the evaluation of the programme and in this blog we share the results.
The Localism Act was introduced in 2011 to give communities more say and greater power in shaping their areas such as what happens to local amenities, the delivery of services and the planning of new development. The Act, and related legislation that has come into force since, has given communities new rights including:
Since the Localism Act there has been ongoing support available to communities to help navigate and exercise the rights including provision of information, advice and guidance. The aim of the Community Organiser Mobilisation Fund was to explore what role, if any, Community Organisers (COs) could play in supporting communities, by building on the success of the Government’s preceding Community Organiser programme which ended in 2015.
The programme was eight months long during which a selection of COs were trained in Community Rights and then worked in their local areas to explore how the rights could help communities tackle important local issues. Organisers attended a residential event and follow-on specialist training. They were supported by a Programme Manager and had regular monthly online supervision sessions.
Through the programme the evaluators Imagine conducted surveys of participating COs, conducted interviews, developed case studies in a small selection of areas, ran a series of workshops to reflect on lessons learned, and assessed programme monitoring information.
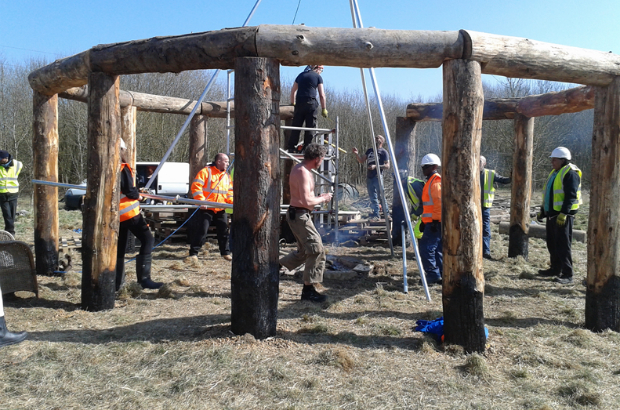
In total 38 COs participated working in 27 neighbourhoods in England. On average they listened to around 200 people each, organised 270 events and recruited over 1200 volunteers to get involved in community priorities. At the end of the programme in June 2016 there were 16 COs working on Neighbourhood Plans; 7 exploring the right to build; 9 the right to bid; 3 the right to reclaim land; and 5 the right to challenge.
Residents in the 27 communities were generally unaware of their rights under the 2011 Act and the evaluation found that COs were particularly successful at raising awareness and knowledge. They were also successful at linking the use of rights to issues that residents were concerned about. In fact, COs found Community Rights a useful lens through which to view issues and with which to engage local people.
Whilst there were other successes, such as buildings being listed as Assets of Community Value (ACV’s) and neighbourhood forums being established, successfully exercising the rights within the 8-months programme was always going to be a challenge. The Organisers did attract volunteers to assist with their projects but it became clear that the length of time and sustained effort required to exercise the rights was an issue. Furthermore, the case studies highlighted the gap in resources and expertise that can exist between residents on the one hand and planners and developers on the other.
The evaluation has identified some of the difficulties in exercising rights and the evaluators provide recommendations for tackling these issues. They provide excellent food for thought but further, stronger evidence is required than was achievable in this short time frame, to support implementation of some of these recommendations.
What is clear, however, is that Community Organisers can narrow the gap considerably between theory and practice. Community Rights are an important tool in the CO’s toolkit for engaging local people and addressing issues. Furthermore there now exists a cohort of skilled COs together with training materials to support mainstreaming the rights into the training and development of COs as government takes forward its commitment to expand COs during this parliament. It is important to ensure the learning from this evaluation is embedded in future work.
Leadership of Community Organisers has moved out of Cabinet Office to the Department for Culture, Media and Sport, and we wish the team well with the delivery of the future programme and its evaluation.
Here is the evaluation report [051216-comfundevaluationreport_final]. If you have questions or views please do get in touch and we will pass on to the relevant team.
Want a more insightful 2017? Subscribe to the Analysis and Insight blog.
]]>On the 19th October we published the findings from the evaluation of the two Uniformed Youth Social Action Funds (UYSAF), commissioned by the Cabinet Office and now part of the Department for Culture, Media and Sport under the Civil Society Agenda.
The UYSAF forms a part of the Government’s commitment to provide more opportunities for young people to take part in meaningful social action. The youth policy team worked closely with the Youth United foundation to ensure the UYSAF programmes were rolled out effectively and since the fund was created in 2014 over 27,000 more places in uniformed youth groups across the UK have been created - well exceeding the target of 15,000!
What do we mean by Uniformed Youth groups?
A Uniformed Youth Group is a youth organisation that has a long-term programme that brings young members together through a shared uniform. This includes the Scout association, Volunteer police Cadets and Girl guides– just to name a few!
The UYSAF consisted of 2 separately evaluated funds:
So what are the main findings?
Fund 1:
The double benefit –there was a positive impact on both those who took part and those who were recipients, with the majority of beneficiaries being positive about the impact of the youth social action. They generally had a more positive impression of what young people contribute and 80% reported feeling more proud of their local area.
Intergenerational relationships – findings suggest that social action can help beneficiaries meet new people, with 90% speaking to a young participant. Those who did were also more likely to report the social action as very worthwhile.
Engagement – the evaluation also demonstrated that even those who were not actively engaged in their communities experienced positive benefits of youth social action.
Fund 2:
Inclusion and engagement– case studies highlighted that membership to Uniformed Youth groups can be accessible and appealing to a broad group of young people, and it was not difficult to get hard-to-reach young people engaged.
Schools – There were a number of advantages to working through schools, including good access to the children and buildings fit for purpose.
However – there were a number of challenges for working with schools, including agreeing initial sign up, legal requirements and school timetables.
]]>
The Community Life Survey is a major national survey, aiming to track the latest trends and developments across areas that are key to empowering communities. It is used to understand what is happening in areas such as volunteering and charitable giving, as well as other ways in which people engage in their communities.
On the 20th July 2016, we released the latest results from the Cabinet Office’s annual survey, reporting on headline findings that measure levels of volunteering, charitable giving, community cohesion, neighbourliness and subjective wellbeing.
What do the findings show?
Volunteering
When measuring volunteering we look at 4 areas: formal volunteering (giving unpaid help through clubs or organisations) and informal volunteering (giving unpaid help as an individual to people who are not a relative), employer-supported volunteering (volunteering that is enabled by an individual’s employer) and any volunteering (both formal and informal volunteering).
Overall, volunteering rates are virtually unchanged from the previous year, and this is true for both regular volunteers (those who volunteer at least once a month) and annual volunteers (those who volunteer at least once a year). This trend is seen across any, formal, informal and employer-supported volunteering, with all levels remaining consistent with those reported in 2014-15.
Charitable giving
Charitable giving is based on whether and how much you have donated, in the 4 weeks prior to being surveyed, providing giving behaviours in an average 4-week period.
In 2015-16, charitable giving remains consistent compared with levels seen in 2014-15 (75%), with 73% giving to charity in an average 4-week period. In addition to this, people gave on average £22 to charity in the four weeks prior to interview, the same as last year, remaining the highest levels recorded across all survey years.
Neighbourhood
We examine attitudes and behaviours towards neighbourhoods, trying to understand people’s views of their local area. In the headline findings we report on community cohesion, communities pulling together, neighbour interaction and sense of belonging.
Over two thirds (68%) of people agree that people in their neighbourhood pull together to improve the neighbourhood, up from 63% in 2014-15. A similar picture is also seen with community cohesion, with levels increasing to 89% compared with 86% in 2014-15, showing that almost nine in ten people agree that their local area is a place where people from different backgrounds get on well together.
Levels of belonging to Britain and to neighbourhoods remains relatively stable compared with last years figures, as does levels of chatting and exchanging favours with neighbours.
Civic Engagement
Civic participation continues to be the most common form of civic engagement with the proportion of people participating at least once a year rising from 30% in 2014-15 to 34% in 2015-16.
Both civic consultation and civic activism are barely unchanged from levels reported in 2014-15.
Wellbeing
The survey covers 5 key measures of wellbeing: Life satisfaction, Happiness yesterday, Anxiousness yesterday, feeling things you did were worthwhile and loneliness.
All measures have remained consistent with levels reported in 2014-15, apart from life satisfaction where we have seen an increase in levels, with people reporting an average of 7.9 out of 10, where 10 is completely satisfied with their life.
Overall, we feel the picture is positive, with most measures remaining stable compared to last year’s findings, and some increasing significantly. The full dataset will be made available in the autumn to allow additional analysis and from next year we will be moving to an online/postal survey method, enabling us to increase the sample size and hopefully dig further into the data.
You can find the official bulletin and data tables on our Gov.uk webpage and the Cabinet Office’s official response to the consultation on moving the survey online here.
]]>
From Brazil to Luton…
In 2014 the Centre for Social Action supported an innovative approach to community development and to improving the well-being and employability of the long-term unemployed. It was based on a Brazilian approach with social action at its core – the Organisation Workshop – and the project enabled this approach to be trialled for the first time in the UK at Marsh Farm in Luton.
Cabinet Office commissioned an evaluation to understand how the project worked and to learn lessons for future implementations in the UK. The findings are now in and you can see a summary here. So what is an Organisation Workshop and how did the Marsh Farm project go?
A ‘Large-Group Psychology’ Approach
Organisation Workshops (OWs) are based on ‘large-group psychology’, often bringing together groups of 100 people or more, and on principles of self-organising and learning by doing. Participants are tasked with delivering a project that is of benefit to the community. They must organise themselves to deliver it with carefully calibrated levels of external support that is non-directive and allows participants to learn by trial and error, in a mutually supportive environment. The aim of the project is to trigger a step change for the participants, in terms of their self-confidence, their relationships, their organisational and other skills, and their capacity to improve their own lives.
The project is only the first of three phases. In the second phase participants are helped to develop business plans for local community enterprises, leading to a final phase of these enterprises being established. So the approach is ambitious by aiming to foster new community businesses as well as moving the long-term unemployed into self-employment.
What happened in Marsh Farm?
In Marsh Farm a total of 45 long-term unemployed were recruited onto the programme some with particularly complex problems, struggling with depression, lack of confidence and low self-esteem. Together they transformed a 5 acre abandoned field into a community resource complete with paths, orchard, flower-beds, vegetable garden, bee-hives and ‘iron-age replica round house’.
As of Spring 2016, the programme is well into phase 2 with a number of new community enterprises currently in development or starting to trade around bee-keeping, a community farm, a building co-operative, a catering business, music related and IT services. It is too early to say how successful these will eventually be and which businesses will sustain – but some of the business ideas are clearly becoming a reality.
What were the outcomes for participants?
The evaluation was largely based on interviews with those involved in delivering the programme as well as those participating in it, and with the public sector services that supported the project. Interviews with participants indicated they felt they benefitted in a number of ways including gaining confidence, making new friendships, having a greater capacity to cope and increased resilience. Some gained valuable employability skills and qualifications in areas such as health and safety, hygiene, employment rights, customer services, finance and administration.
By the end of Phase 1, 44% of participants had been able to find mainstream jobs and a further 28% remain on the programme progressing towards setting up their own community enterprises. While it is not possible to conduct a robust comparison with similar programmes – the evaluators found that the employment outcomes generally compared favourably with relevant national support programmes for the long term unemployed.
Next steps
There were a lot of lessons learned and the evaluators highlighted the need for more trials of this approach, as well as suggesting the establishment of a national incubator organisation for OWs. It is perhaps premature for anyone to consider setting up such an incubator at this stage. For the time being we will see how the community enterprises in Marsh Farm develop, and all eyes will soon be on Hastings which will be the next place in the UK to trial this innovative approach.
Contact us if you want more information
If you are interested in Organisation Workshops and would like to see the detailed full report with lessons learned please let us know below and we will send it to you.
]]>We survey because:
Why a cross-Civil Service survey?
The survey operates a census approach with all staff working in participating organisations invited to take part. There are around 100 different organisations which take part and since 2009 we have been running one cross-Civil Service survey instead of having 100 different surveys for 100 different organisations. Taking this approach has helped us to:
In 2015 the census approach allowed us to produce over 10,000 reports for managers and teams meaning that action based on the survey could be taken at all levels – from Civil Service wide to individual team level across the Civil Service.
Adapting to learn and to improve
All employee surveys should adapt to reflect shifting attitudes and organisational changes over time and the survey has adapted several times since a single questionnaire was designed, piloted and launched in 2009. For example, since 2012 we’ve included questions on subjective wellbeing - the results can help us to recognise the signs and drivers of low wellbeing and provide targeted support to improve health, engagement, productivity and performance.
In 2014 we initiated a review of the questionnaire to ensure that it remains an up-to-date and relevant source of data. The review, in four stages, continued throughout 2015.
Stage 1: Written consultation
We invited survey managers and other stakeholders to share their views, in writing, on the existing question set. The written consultation was designed to identify strengths and weaknesses of the existing questions as well as potential new questions for testing.
Stage 2: Question testing
In response to the feedback we received, the second stage involved carrying out a programme of online question testing. Upon completing the 2015 survey a random sample of respondents were invited to answer a small number of further test questions.
Stage 3: Desk review
The desk review comprised established research techniques (including factor analysis, examination of face validity and correlation analysis) to enable us to evaluate each existing question.
Stage 4: Consultation in person
This stage involved interviews with survey respondents, workshops, and meetings with stakeholders to discuss our findings. Participants were offered the opportunity to identify which new questions they would like to include in future questionnaires.
2016 and beyond
The review has led to some initial changes to the survey this year, for example, the overall questionnaire will be shorter while additional questions will be included to give stakeholders further insight on bullying & harassment.
We’ve just started to compare our survey to those used in other countries (including Australia, Canada and the US) to see what we might learn from or share with them.
We’re looking forward to analysing and sharing organisations' survey results at the end of the year and will continue to review the questionnaire to ensure it aligns with the longer term vision for the Service. However, before making significant changes we are further considering the impact of disrupting the time series versus the need to capture emerging priorities.
]]>National Well-being Framework – Quality of Life indicators with a difference
In March 2016 the ONS released the latest Life in the UK figures, providing us with a snapshot of how the nation is doing across those areas of life most important to our well-being. There is good news and many areas of our lives are objectively getting better: household income is up, unemployment and crime are falling, and healthy life expectancy is rising. Our personal well-being – how we rate life overall – is also improving. However not all areas of our lives are getting better, and many of the measures assessed as having ‘deteriorated’ relate to our subjective views on how we feel we are doing. For example the proportions of people satisfied with their health, accommodation, household income and leisure time have all fallen over the three-year period since measurement began.
People’s personal ratings about their lives are just as important as data on their background circumstances
The national well-being framework gives us a more complete picture of life in the UK and shines a light on just how important it is to consider both objective and subjective measures of progress. Whilst objective measures are undoubtedly important, subjective measures get to the heart of people’s lived experiences and how they really feel their lives are progressing. We can see from the data that improvements in people’s objective circumstances don’t automatically translate into better subjective experience – for example incomes are up, but satisfaction with income has gone down, and healthy life expectancy has improved while we are collectively less satisfied with our health - and it is in this way that the framework gives us insights we could otherwise miss.
So what does this mean for policy?
There is therefore a strong case for analysts, policy makers and services designers to be interested in and to take account of subjective well-being measures. Indeed, if we think about people’s satisfaction with different aspects of life rather than just their objective circumstances, policy approaches could look quite different. Take crime as an example. If crime is going down and fear of crime is going up, then perhaps reassurance communications might be part of the policy mix. If both are deteriorating, then perhaps more public dialogue and engagement around the priorities and solutions might help. And if all are improving, continuous improvement and celebrating success might be part of the approach.
With this in mind we have put together the simple table below to highlight the different possible combinations of how the indicators are moving. The aim is to provoke thinking about how policy might be different depending on the extent to which people’s objective circumstances and their reported experience agree or disagree.
Tell us your thoughts
Of course to use this you have to collect data (or use existing data) on how people rate their satisfaction with different aspects of their life – work, income, health, housing, education, crime etc. We think the consideration of such indicators is really important so please let us know your thoughts, and whether you find this table useful.
]]>
On 11th March we published a report on the size and characteristics of the social enterprise sector. The report provides an update on the Social enterprise: market trends paper published in 2013. Government is an important source of data in this sector and reports such as these are valuable sources of information for policy makers and other stakeholders.
What are social enterprises?
There is no universal definition of a ‘social enterprise’. Most agree, however, that social enterprises are businesses who have a clear social or environmental mission and who reinvest their profits back into the business to achieve this mission. This definition is consistent with the one given by the national trade body for social enterprise, Social Enterprise UK. Social enterprises can sometimes take specific legal forms such as a Community Interest Company or Companies Limited by Guarantee. These are not a necessary feature of social enterprises but can create an ‘asset lock’ which ensures that profits are used for a social purpose.
What did the report find?
The report highlights some key characteristics of social enterprises in 2014, drawing comparisons between social enterprise employers and the general population of small and medium sized enterprise (SME) employers. These comparisons are intended to be useful to those wishing to better understand the comparative characteristics and experiences of social enterprises and will help to inform policy development for the social sector.
The report estimates that there were 195,000 social enterprise employers in the UK in 2014 and that social enterprises employed around 2.27 million people. Interestingly these enterprises were significantly more likely than SMEs overall to be led by women or a member of minority ethnic group and were more likely to be located in the 20% most deprived areas. The report also finds that social enterprises in 2014 were more likely to be profitable than in 2012. This is promising news for the social sector and suggests it is becoming more sustainable.
However, the report also indicates that social enterprise employers are significantly more likely to have difficulties accessing finance than other SME employers and are less likely to eventually obtain it. Forty-nine per cent experienced difficulty in obtaining finance from the first source they approached, compared to only 39% of SME employers overall. This could restrict the growth of the sector as over a third of social enterprises aiming to grow intended to apply for external finance to fund their growth.
Where did the data come from and how reliable is it?
The analysis is based on data gathered in the Small Business Survey (SBS) 2014 commissioned by the Department for Business, Innovation and Skills. This survey is not specifically targeted at social enterprises but every other year it includes a number of questions that allow certain SME employers to be classified as such.
The SBS has many advantages as a dataset. It asks a broad range of questions, with the full dataset containing roughly 800 variables. It is also a large survey with over 4,000 businesses participating, of which Cabinet Office classify about 700 as social enterprises. These sample sizes are large enough to give statistically significant results.
However there are some caveats to bear in mind. While the overall sample size is relatively large, some questions, such as those around access to finance, are only answered by a subset of SMEs and have a smaller sample size. These results should therefore be interpreted with some caution. Also, as there is no one definition of social enterprise, the results in the report may not be comparable with other reports on this sector.
What else is going on in the sector?
There is currently a lot of interest in social enterprise and social investment in the UK. The UK is considered to have the most developed social investment market in the world and this is reflected in the interests of consumers and investors. Consumer insights company Nielsen finds that 1 in 3 UK consumers are willing to pay more for socially responsible products and Morgan Stanley finds that 72% of active individual investors believe that companies with good environmental, social and governance practices are better long-term investments.
Recognising that social enterprises support growth and drive innovation, but have difficulties accessing finance, the UK government has played a role in expanding the social investment sector. It has had a social investment strategy since 2010 and the latest strategy outlines how the market has grown in recent years, as well as how further growth will be supported in 2016/17.
Most recently, the Minister for Civil Society has launched a review to examine how the related emerging sector of mission-led businesses can be supported. You can stay up to date with what the government is doing about social investment and social enterprise online.
]]>
The benefits of civil servants volunteering, to both themselves and charities, were laid out in a recent CSQ article. In this spirit we’ve recently completed a volunteer research project for the British Science Association (BSA). Given the amount we learned from the project we thought it worth sharing our experiences, some of the techniques we used, and what we found. Before reading on please note that the work was undertaken independently, we were not acting on behalf of Government.
Getting involved in pro bono work with the BSA
Pro-bono economics (PBE) is a charity that matches volunteer economists, like us, with charities, like BSA, who could benefit from an economist’s skill-set. They also provide economic advice, help to manage the work and ensure published work is anonymously peer-reviewed. BSA were interested in building the evidence base behind whether or not participating in their CREST awards programme has an effect on students’ science attainment and STEM subject selection.
The CREST programme is an inquiry-based learning intervention which BSA describes as ‘hands-on science’ which ‘builds transferable skills for further education and future employment’. There are four levels of Award, but we focused on evaluating the Silver Award, which consists of around 30 hours project work typically undertaken by 14-to-16 year olds. Given BSA research interests, we sought to answer:
(i) What are the characteristics of students taking Silver CREST Awards?
(ii) Does participation in the Silver CREST Award programme have an impact on attainment in science subjects at GCSE level?
(iii) Does participation in the Silver CREST Award impact on the likelihood of taking a STEM AS level?
What did we do?
We linked the data we had on Silver CREST pupils, held by BSA, to the National Pupil Database (NPD), held by the Department for Education (DfE). This enabled us to compare the characteristics and outcomes of CREST and non-CREST pupils. When trying to ascertain the effect taking the Award has had on outcomes (GCSE science performance and STEM subject selection at AS level) it’s important to make a fair comparison, which isn’t biased by confounding factors. To do this we used a matching method called ‘Propensity Score Matching’ (PSM) which, out of the millions of pupils in the NPD who didn’t do CREST, helped us to select a much smaller group with similar characteristics to the CREST cohort. This comparison group had similar prior attainment (at Key Stage 2), similar gender and ethnicity profiles, similar proportions of pupils eligible for free school meals (FSM), and so on. There were, however, a number of unobservable factors, such as teacher and pupil enthusiasm, which we could not match on.
What did we find?
We found that students who participated in Silver CREST were broadly representative of the wider pupil population in terms of gender and ethnicity. However, the CREST students were also different in many respects. For example, they were substantially less likely to have been eligible for FSM and had achieved stronger results at KS2 across all subjects.
Even after controlling for these differences we found that CREST pupils achieved half a grade higher on their best science GCSE result, compared to a statistically matched control group. The effect was slightly larger when looking only at FSM pupils. When looking at the impact of CREST on STEM subject selection at AS level we found CREST students were 21% (or 14 percentage points) more likely to take a STEM AS level than students in the comparison group. Again, the difference was larger for FSM pupils.
Because these results come with the significant caveat that we weren’t able to control for influences like pupil enthusiasm, these cannot be interpreted as the ‘causal’ effects of taking Silver CREST. However, our research suggests that CREST awards appear to be having a positive impact. To test this, our main recommendation is to design a randomised control trial (RCT) to take the evidence behind CREST to the next level.
What did we learn?
We learned a lot from the project, too much to detail here, but these are our main takeaways:
You can find the full report here. If you’re interested in finding more out about CREST awards, look here. If you’re either a charity or an economist and you’re interested in the work PBE do, look here. If you want to know more about our experiences with pro bono work, or if you’ve done some yourself, please share your thoughts below.
]]>Following on from our public dialogue into wellbeing in 2014, we partnered with the What Works Centre for Wellbeing to run another dialogue, this time to help them shape their evidence programmes. The findings are published today.
The series of dialogues were held last year, delivered by Hopkins Van Mil and supported by Sciencewise and Public Health England. Meetings were held in six locations across the UK including Scotland, Wales and Northern Ireland. We brought policy-makers together with members of the public to talk about what they thought the priorities for the Centre should be and to inspire new ideas for supporting and improving wellbeing. The discussions focused on wellbeing in three areas of our lives:
Why public dialogue?
The public will be a key customer for the What Works Centre for Wellbeing, so it made sense for them to be involved in the decision making processes around what the Centre focuses its energy on. Public dialogue and wellbeing evidence are complementary, as we found out in our first round of dialogues in 2014, because wellbeing is fundamentally about people, their experiences and what matters most to them, and public dialogue gives participants the time and space to explore these in depth. Therefore, a dialogue on the work programme of a wellbeing centre made perfect sense.
Shaping the work programme
So, how did they go? These public dialogues have given us a real insight into people’s priorities in the areas we’re interested in and have helped to inform the work plans of the What Works Centre. There were some cross-cutting findings and overlapping themes which came out in all three dialogue areas, however participants were keen to emphasise the basics: Wellbeing needs included being safe and loved, having sufficient money and good physical and mental health. The opportunity to access good quality and affordable food also emerged as a strong cross-cutting theme. There was also emerging consensus around the main barriers to wellbeing, which were identified as a lack of time and money, low confidence and support, limited information and an unsatisfactory work-life balance, alongside a lack of affordable good quality housing and reliable transport.
Next steps
Academic teams at the What Works Centre for Wellbeing have already incorporated the findings from the dialogues into their work plans. These plans will be delivered over the next two and a half years, ensuring that the Centre’s outputs directly reflect the needs of the public, along with other stakeholders. Detailed findings on each of the three areas and the Centre’s work plans can be found here.
Please let us know your thoughts below.
]]>