In September and October many of us attended Civil Service Live at different venues around the country. The events were excellent and packed with seminars, interactive workshops and networking opportunities to share and inspire good practice across a host of areas of work. We had the pleasure of hosting a session at the London event to present some of our experiences using new tools and datasets for policy analysis. We had a great discussion with fellow delegates and thought we should share the highlights.
New tools and open datasets are creating new opportunities…
The time is clearly right to be trying out new tools and large data sets. Our desktop technology is becoming more accessible, flexible and faster. There is a proliferation of free, open source analysis applications, many of which are collaborative which means that if someone has solved the problem before, you can undoubtedly benefit from and reuse their solution again. ‘Scraping’ and ‘harvesting’ data from the internet and social media is becoming easier providing efficient and effective alternatives to conducting surveys when appropriate. Add to this the availability of high quality national statistics datasets and the ability to link these with other data – and it is clear there are considerable new opportunities for the government analyst to produce impactful evidence for our policy customers.
… but the analyst’s job is getting more challenging
While the tools are improving, the analyst’s job might also be getting more challenging. Budgets are getting tighter for both policy delivery and for evaluation. So we have to think about new and more efficient ways of gathering evidence that enhance policy delivery rather than burdening it. Furthermore, many policies devolve delivery of solutions to local areas which makes the task of coming up with a common set of impact measures, and common learning, all the more difficult.
New tools and datasets - opportunities and challenges
So what have we been trying out to realise the opportunities and meet these challenges? Here’s a few examples to illustrate.
Tools
We have been testing Rapid Miner – a suite of tools that permits, among other things, text mining and website analysis. The base package is free, rich in functionality and you don’t need to be a programmer to use it. We used it to quickly assess and categorise project summaries from over 16,000 locally devolved initiatives across England – saving considerable time that would have been associated with inspecting and categorising the projects manually. On the same programme we also used it to periodically assess whether nearly 600 local websites had been set up to raise awareness of the initiatives to local people. Our analysis saved time in visiting the web sites manually and provided clear evidence of the need to help the local communities in developing their web presence – subsequently enhancing policy delivery.
We have also been trying out new software to visualise and communicate evidence. Tableau produces a range of data visualisation products that are intuitive and quick to use even with large datasets, and provide visually appealing, interactive charts and dashboards. There is a free trial version of the desktop product, as well as a free online platform called Tableau Public. The online gallery will give you an idea of what is possible using the software. We have found Tableau useful for visualising a range of data to produce interactive charts (e.g. where the reader ‘hovers’ over a data point to reveal more information), or dashboards visualising several related charts on a single page. The drag-and-drop interface is very intuitive to use so Tableau is very quick to get started with. We continue to evaluate this software – the full desktop version requires a subscription per user.
We have also tested free data visualisation packages. Raw is a good example of a free web app for visualising data. It is simple to use: you drop a file with your data into your browser (data is processed in your browser, not sent or stored anywhere), select the type of chart you want to create, and then select the variables to visualise. You can customise the chart (e.g. size and colours). Once the chart is ready, you can embed this into an HTML or download. Unlike many other free online tools, Raw does not require any coding knowledge to produce new ways of visualising data.
Data sets and Data linking
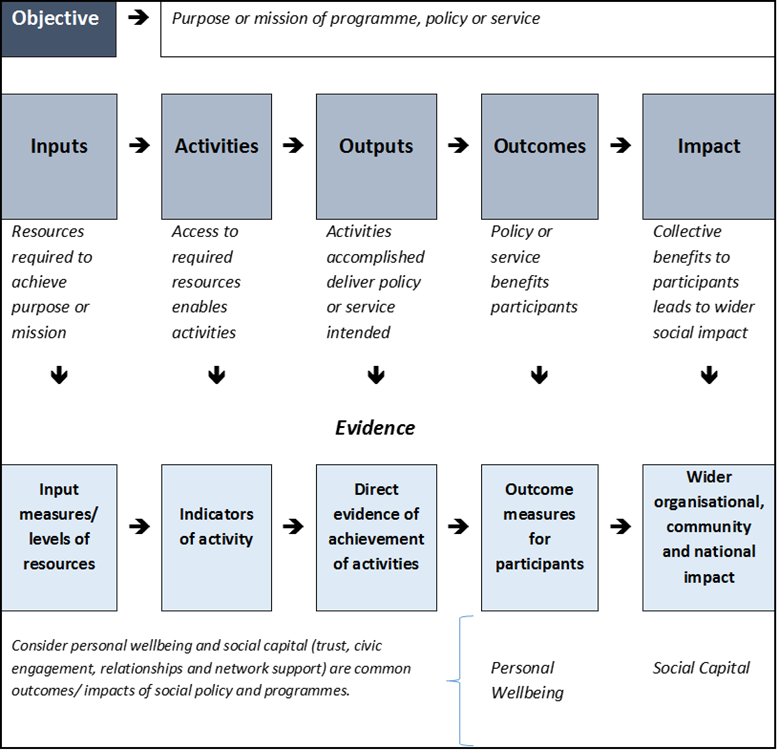
As mentioned, the devolved nature of some policies makes life difficult in developing common sets of impact measures with which to evaluate policies developed nationally but delivered locally to different priorities. Here some of the new national statistics datasets can help – particularly the ones around wellbeing and social capital. Both wellbeing and social capital are common outcomes and impacts from social policies – as illustrated in the theory of change below based on Magenta Book guidance. We’ve taken advantage of opportunities to add relevant questions into evaluation surveys, as well as analysing existing national survey data, to see if our programmes or policies explain variation in these important outcomes.
For the Community Organiser programme we commissioned an extension to the Community Life Survey in relevant areas and analysed differences against control areas. For the Community First Programme we analysed existing national survey data, without the need for any additional surveys, and assessed whether the presence of project activity explained variation in wellbeing and social capital.
Both of these examples required us to map project activity to national survey results and for this we used QGIS – a free, open source mapping package that is easy to use.
Tell us what you have found useful
At Civil Service Live colleagues reminded us that there remain some barriers to using these new tools including IT, data security, cost etc. However our experience has been positive so far, and illustrates that there are opportunities to be taken as some of these barriers are addressed.
In this blog we have highlighted a few of the tools we have been using - some free/ open source and others paid licenses. There are obviously many other analytical tools available and we will continue to try these out and report back on our experiences. In the meantime tell us about what you are using or the barriers you are facing in trying out new tools.
Recent Comments